Description
Originpro 2024b V10.1.5.132 Cracked
 How To Buy and install Originpro 2024b V10.1.5.132 By Ma-x Group
Origin 2024b Feature Highlights
Redo and Improved Undo
This version introduces Redo feature, and improved Undo to enhance your user experience:
- Redo (Ctrl+Y) allows you to quickly reapply an action without having to repeat the steps manually
- If you accidentally undo too many actions, redo lets you recover those actions without losing your work
- Undo (Ctrl+Z) works in more actions, such as delete folder, change plot or object orders
- Undo Window Positioning (Ctrl+Shift+Z) such as minimizing, resizing, moving
Annotation and Graphic Object Improvements
Several improvements have been made for editing and manipulating text annotation and graphic objects:
- CTRL+Drag to create duplicate object(s) at new location
- Center, left, or right align a single object relative to page
- Edit member(s) of grouped object without ungrouping
- Show Plots/Show Graph Object toggle button in Object Manager
- Display text contents in Object Manager
- Out-of-page object indicator (gray background) in Object Manager
- Edit Points Mini toolbar to change Polyline, Curve, Polygon, and Region shapes
Unstack or Split Date/Time Data Based on Time Interval
Convert long-format (XY) Time Series data into wide-format (XYXYXY…) for easy graphing, exploration and analysis of the sub-segments:
- Common Time Intervals: Year, Month, Week, Day, Hour, Minute
- Auto-detection of Date column in Source Sheet
- Set Start and End in Interval and Date Wrapping
- Option to add Additional Label Rows to identify date and time intervals of the sub-segments
- Customize Date info. in output
Time Series Explorer Graph
Use the Time Series Explorer graph template to graphically explore time series data:
- Graph template is available under Extended Templates from Plot menu
- Lower level displays entire time series
- Set time interval for ROI using drop-down menu
- Data for chosen interval is displayed on top layer
- Use forward/backward and play buttons to flip through and explore data
Create Graphs Directly from Image Window
Plot menu for Image Window, no need to convert image to matrix data.
- Histogram
- Contour & Heatmap
- Image Plot & Image as Background
- Contour Profile & Image Profile for grayscale image
- 3D surface
- Browser panel to toggle graph for different frames in same image window
Time Series Analysis App
Origin provides the following Time Series tools to help users explore, visualize, and analyze their time series data.
New Graph Types
The following new graph types have been added in this version:
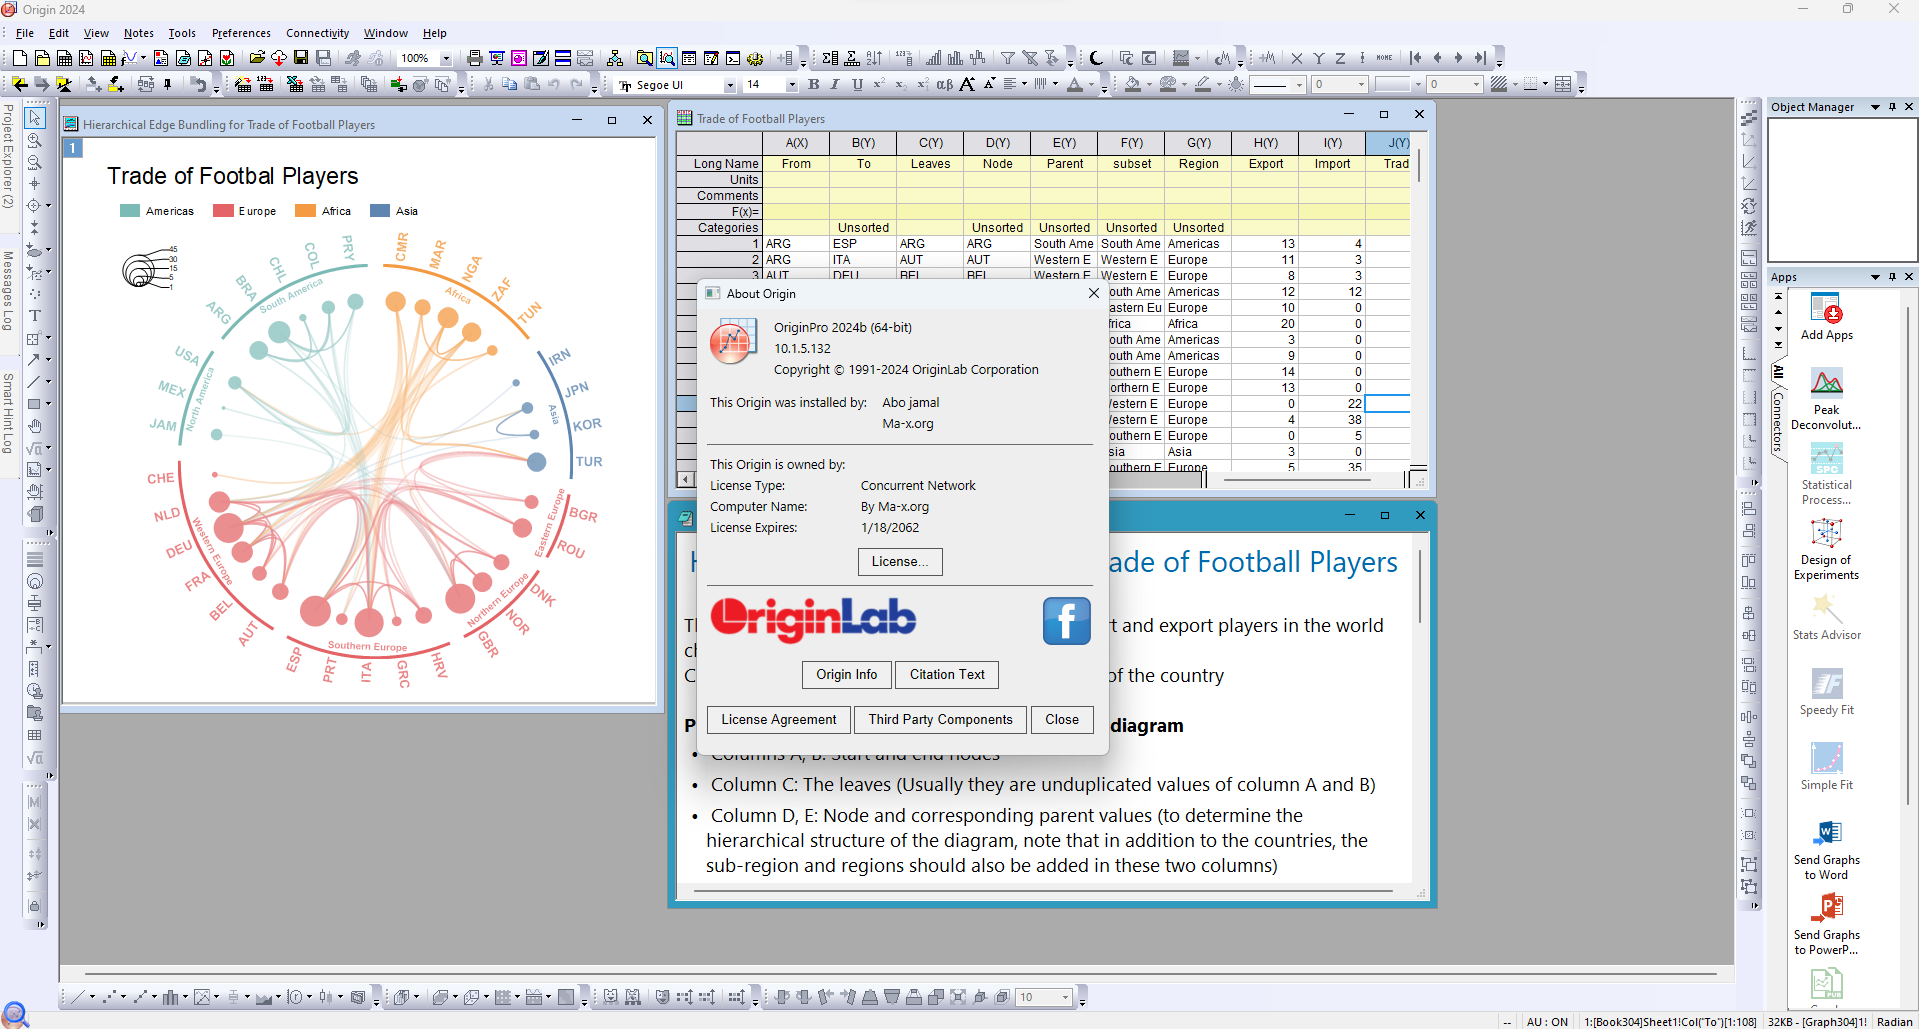
- Hierarchical Edge Bundling
- 3D XYZ Floating Bar
- Streamline Plot
- Contour + Gradient
Working with Files on SharePoint, OneDrive and Google Drive
You can now work with files stored on SharePoint from Origin:
- Connect to data files (such as Text/CSV or Excel) on SharePoint to import data
- Open Origin project from SharePoint, make changes, and save back to SharePoint
- When opening projects, if the project is currently open by a colleague, Origin will open as read-only
- You can now open and save Origin project files also from OneDrive and Google Drive
Originpro 2024b V10.1.5.132
Full Cracked By Ma-x Group


santt wick –
i just got it and it works , best crack since v2021.
bassam –
thanks a lot man ,,,, you just make my day…
the crack work very goood
edward007 –
you the best abo jamal
bigboy99 –
its very stable
tested for 8 hour no crack logo no graph limit no errors
i hope you can make some discount for second pc
klase –
after 4 days of test and work this is the most stable crack i ever use for Origin
reamna –
thanks max group